
by Mike Donnelly
9 January 2017
PartQuest Explore provides a family of measurement models that perform “Time Domain Frequency Sweep” (TDFS) analysis. They measure the frequency response of many circuits and systems for which traditional “AC” or frequency-domain simulation is not possible. This includes:
- Switching circuits
- Mixed-signal (analog + digital) circuits
- Sampled data control systems
- Systems that include modulation or transformation functions
Let’s first look at a switching application: Switched-Capacitor Filter Frequency Response using TDFS

The figure shows the use of TDFS to measure the frequency response of two low-pass filters. The top circuit is just a simple analog RC filter with 1 kHz cut-off frequency. The lower circuit is an equivalent filter using a switched-capacitor (SC) implementation. Both small-signal AC (frequency domain) and TDFS (time-domain) simulations were run, and they give the same result for the RC filter. But because of the switching behavior the SC filter, there is no operating point at which the circuit can be linearized, so the AC analysis results are meaningless. The TDFS approach, however, does give a valid frequency response for the SC filter. The on-schematic waveform viewers show that the RC and SC filter have nearly identical transfer functions, with dB magnitude gains plotted in the upper left viewer window, and the phases in the lower left. Note that the green waveforms correspond to the TDFS instrument’s channel 1 input (RC filter), and the light blue waveforms correspond to the channel 2 input (SC filter).
(Note: You can click on the link or the image and it will open a “live” version of this design in your browser. You can interact with the design (e.g. move waveform probes around) or make a copy of it, change as desired and then run new simulations. This is currently not available on mobile devices).
The operating concept of TDFS is quite simple. The circuit or system under test is biased to its operating condition, and a time-domain simulation is performed while a sinusoidal input stimulus signal is applied. The response to that stimulus is observed at other points in the circuit. The in-phase and quadrature components are measured and used to compute the gain and phase of the transfer function at that frequency. The stimulus frequency is automatically stepped to discrete values over the user specified range, to generate the complete frequency-response profile. The unprocessed time-domain filter output signals are shown in the upper right viewer window. The amplitude roll-off at higher frequencies can be clearly observed.
Here is mixed-signal application example: TDFS for a Mixed-Signal Band-Pass Filter
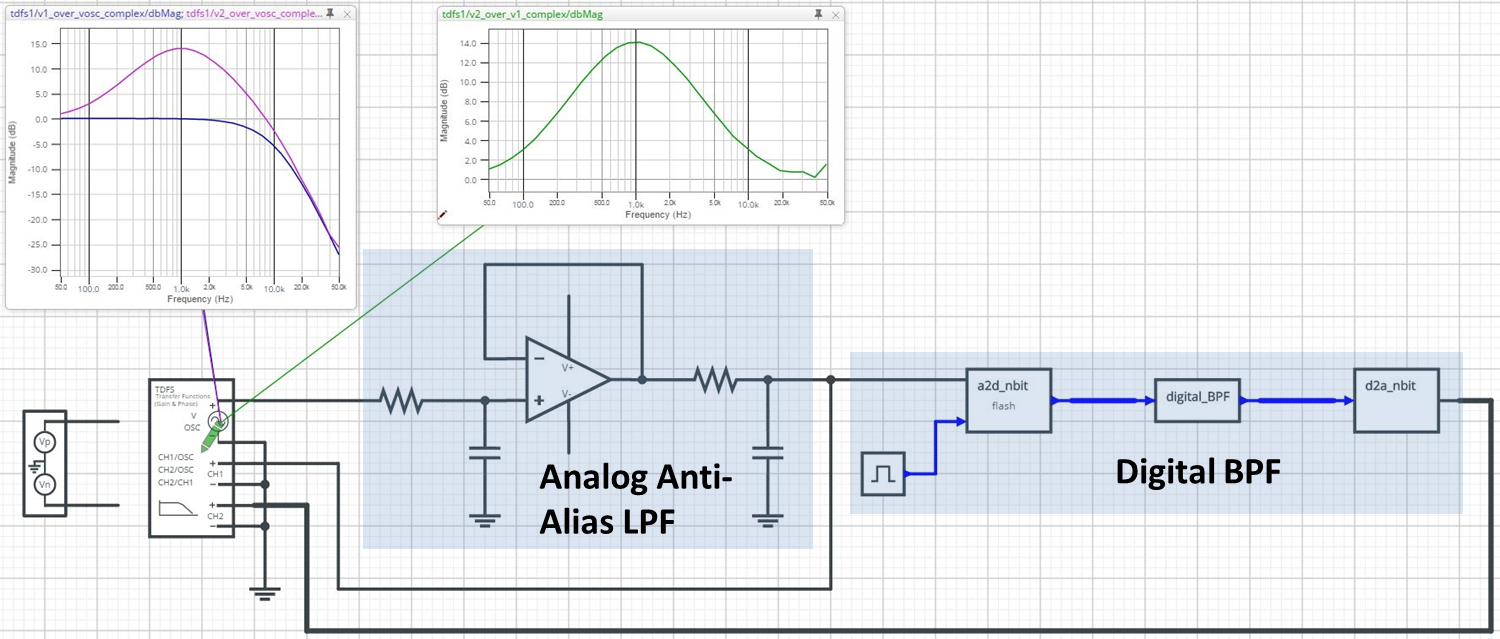
This example shows the use of TDFS to measure the frequency response of a mixed-signal band-pass filter (BPF). This includes both the analog anti-aliasing low-pass filter, as well as an 8-bit, second-order digital BPF. The TDFS instrument performs gain and phase measurements for these two stages of the filter, both separately and combined. Like the switched capacitor filter, it is not possible to perform an AC analysis on the entire filter circuit, because of the discrete states and transitions used to describe the digital behavior.
Note that the TDFS oscillator stimulus is applied to the anti-alias filter’s input. The output of the anti-alias filter is monitored by channel 1 of the TDFS instrument. The full (mixed-signal) BPF output is monitored by channel 2. In the upper left waveform viewer, the dark blue waveform is the dB magnitude of the channel 1 input, so it is the gain of the anti-alias filter alone. The magenta waveform is the dB magnitude of the channel 2 input, or the gain of the entire band-pass filter. Finally, the green waveform in the upper-center viewer is the dB magnitude of the channel 2 input divided by the channel 1 input. The TDFS instrument computes this ratio so it can be used to identify the transfer function from any point in a circuit to any other point. In this case, it represents the gain of the BPF’s isolated digital section.
TDFS Measurement Model Features and Usage
The user can specify the starting and ending frequencies of the sweep range, the total number of frequency points (or steps) for the frequency response measurement, and whether those steps are logarithmic or linearly spaced. The amplitude of the stimulus can also be specified. It should be sufficiently large so that the corresponding measured response voltages are above any noise in the circuit (e.g. ripple voltage from a switching circuit). But the stimulus should also be small enough to stay within a linear region near the desired operating point of a non-linear circuit.
The user can specify an initial delay before the sinusoidal stimulus is applied and the measurements start, to allow the circuit or system under test to settle at its steady-state operating point. The stimulus source also provides an optional DC offset voltage, which may be needed to bias the circuit to the desired operating point.
The TDFS measurement model automatically stops the simulation run when the measurements are complete, so the user can simply enter an approximate simulation end-time, as long as it is greater than the actual time needed to complete the measurements. That required time depends on the number of data points, the frequency range and the accuracy specified by the user. A formula to calculate a reasonable value for the end-time is given in the on-line model description.
More to this Series!
In Parts 2 and 3 of this blog series, I discuss other TDFS measurement capabilities and models that are provided in PartQuest Explore. In Part 2, I show how you can assess the closed-loop stability (i.e. open-loop gain and phase margin) for circuits and systems that include switching, modulation or sampled-data control aspects. In Part 3, I demonstrate the ability to measure the input impedance vs. frequency for a switching power converter, and determine the impedance stability of a distributed power system, where long cables (i.e. transmission line!) can have a significant destabilizing impact.