by IrahComia
17 August 2015
Irah Comia
Lithium ion batteries are incredibly popular. They recharge phones, laptops, cameras, and now cars. These batteries are highly efficient and have changed the outlook on the battery industry. When approaching high temperatures, lithium ion batteries can be dangerous and extremely flammable. Modeling is a perfect way to avoid these errors; it can be used to work as a standard lithium ion battery and behave in an electronic circuit.
Understanding a Lithium Cobalt Oxide Battery Cell
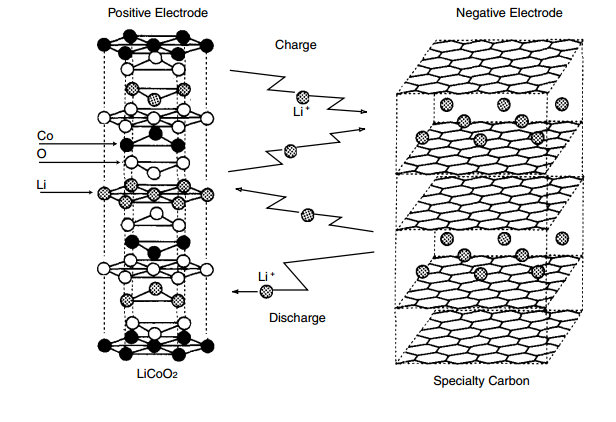
Batteries are electrochemical cells that use chemical reactions to create electricity. In a lithium cobalt oxide battery cell, chemical reactions takes place in the cell and it generates energy to either charge or discharge the cell. There is always an anode and a cathode in a cell. In this case, the cathode is the positive electrode which is the lithium cobalt oxide and the anode is the graphite. Graphite layers are created in the anode. So, when the cell is charging itself, the lithium ions move from the cobalt oxide to the spaces in between the graphite layers. When it is discharging itself, it moves from the spaces in between the graphite layers to the cobalt oxide.

Figure 1. Lithium Ion Battery Diagram from http://industrial.panasonic.com/lecs/www-data/pdf/ACA4000/ACA4000PE3.pdf
Testing the Lithium Cell
In order to create an accurate model of a lithium cobalt oxide cell, testing is important. A potentiostat is ideal to making test on the cells. Potentiostats essentially measure the voltage, impedance, and current between the anode and the cathode. The potentiostat used for this particular model is from bio-logic.

Figure 2. SP-300 Potentiostat from bio-logic
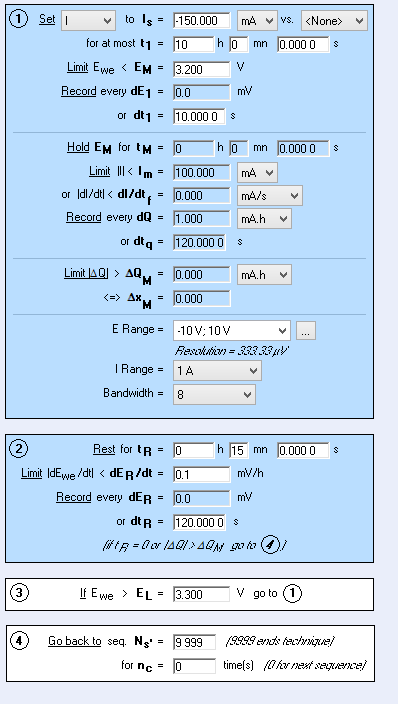
Data that is important to get from the potentiostat is the galvostatic cycling (charge and discharge) and the potentio electrochemical impedance spectroscopy (EIS). These test require a set of parameters to get data. Below, is a set of parameters to discharge the cell at a charge rate of C/10. The charge rate is how long it takes the battery to either charge or discharge the battery. At a charge rate of C/10, it would take 10 hours for the battery to be fully charged or discharged because it is one-tenth of the capacity. Charge rates are defined by the capacity.

Figure 3. Example of Parameters on a Discharge Cycle at C/10 Charge Rate.
When charging or discharging the cell, put in or pull out current at a charge rate of C/10, C/5, C/3, and C/1. This will give more data on the cells and help create an accurate model.
Figure 4. Data at a charge rate of C/10.
When receiving data from the potentiostats, the discharge and charge graphs will look similar to the figure above. These curves are what the model should replicate.
Modeling a Lithium Cell
Polarization curves are central in a lithium battery cell. They dictate the performance and the energy losses in the battery. Polarization curves primarily make up the equations in the model of the cell.
There are three regions in the polarization curve:
The first is the activation loss and it happens at low current densities and is due to the over potentials. The second is the ohmic loss and it happens over the course of the reaction due to the electron and proton transport. The third is the mass transport loss and it happens at high current densities and causes a sharp drop in voltages.
Look at this blog and see that the polarization equations are exactly the same. This is because lithium cobalt oxide cells are electrochemical cells. Electrochemical cells should have similar equations.
Lithium Cobalt Oxide Equations
The lithium cobalt oxide model behaves as a voltage source where the voltage is dependent on the current supplied by the lithium cobalt oxide source. See Table 1., below, for a description of all of the variables, coefficients, and constants.
| Symbol | Description | Units |
Type |
Typical value |
|---|---|---|---|---|
| Lithium cell current | ampere | Independent | - 1.2 < |
|
| Lithium cell temperature | kelvin | Independent | 300 K | |
| Lithium cell terminal voltage | volt | Dependent | 0 - 4 V | |
| Lithium cell open circuit (zero load current) voltage for a single cell, relative to the state of charge | volt | Dependent | < |
|
| Activation voltage drop, without considering time-dependent charge dynamics | volt | Dependent | < |
|
| Activation voltage drop, including time-dependent charge dynamics | volt | Dependent | < |
|
| Voltage drop due to fuel cell internal resistance | volt | Dependent | < |
|
| Voltage drop due to reactant mass transport across the fuel cell | volt | Dependent | < |
|
| Exchange current density | ampere | Coefficient | 1.0E-3 A | |
| Universal gas constant | Constant | 8.3144621 |
||
| Number of electrons involved in electrochemical reaction | unit less | Constant | 1 | |
| Faraday's constant | Constant | 96485.3399 |
||
| Fuel cell internal resistance | Coefficient | 0.04 |
||
| Empirical coefficient for transport loss | volt | Coefficient | 3.0E-5V | |
| Empirical coefficient for transport loss | Coefficient | 0.015 |
||
| Time delay for activation voltage drop | second | Coefficient | 7200 s | |
| Laplace transform variable "s" | Operator | N/A | ||
| The number of series-connected cells that comprise the fuel cell stack | unit less | Constant | 1 | |
| Sincle cell open circuit voltage | volt | Constant | 3.7 V | |
| Battery capacity | Constant | 1.2 - 1.5 |
||
| State of charge of battery | unit less | Dependent | 0 -1 |
Table 1. Variables, coefficients, and constants
The time-varying, current-dependent voltage of the lithium cobalt oxide cell, , is determined by starting with the ideal open-circuit voltage,
, and subtracting the three dominant loss effects, which are modeled as current-dependent (
) voltage drops. The open circuit voltage of the cell depends on the nernst equation.
Voltage Open Circuit
The open circuit of the lithium cobalt oxide battery is modeled using the nernst equation in terms of state of charge. Instead of using the original nernst equation, where the log function is defined by a concentration of products over concentration of reactants, this equation uses the concentrations in terms of state of charge. The state of charge raw function can be defined below:
When the is less than 0, the
will be set to 0.0. When the
is greater than 1, the
will be set to 1.0. When the
is between 0 and 1, the
will be set to that number. The
will eventually help define the open circuit voltage.
Activation Loss
Instantaneous behavior
The activation portion of the polarization curve is modeled using the Tafel equation. When time-dependent effects are ignored, and when the cell current () is greater than exchange current density (
), the instantaneous activation voltage drop is described below :
This instantaneous activation voltage drop is zero for cell currents less than . R and F are constants (ideal gas constant and Faraday’s constant, respectively), T is the temperature of the cell, and z is the number of moving electrons.
Time-dependency
The activation voltage drop, is related to charge storage in the cells. This effect can be modeled easily by introducing a simple time delay, , between the desired activation voltage (
), and the activation voltage that would be observed if the cells were able to respond instantaneously (
). This can be included in the model by using either a Laplace domain equation for approximating the delay, or an equivalent differential equation form.
The transfer function in the Laplace domain looks like this:
The equivalent relationship in the time domain, as a differential equation, looks like this:
Ohmic Loss
The ohmic resistance loss is a simply a constant internal resistance formed by the conductance path through the cell.
Transport Loss
The mass transport loss is modeled from the empirical data available using two constants, m and n, that model the drop occurs at higher currents.
Model Validation
Before using this li6hium cobalt oxide cell model in a circuit or system application, it is important to first validate it. To accomplish this, the model is simulated in the PartQuest Explore simulator, right here on explore.partquest.com. For your convenience, and to improve clarity, a version of each design used to validate the model has been embedded directly in this blog. If you move your mouse over any of these designs, you will notice that it's live! Try interacting with the design to examine it closer.
Future Work
In order to complete this project, more time was needed to accurately represent the charge data.
Appendix: Lithium Cobalt Oxide Battery Cell VHDL-AMS Implementation
The following VHDL-AMS code is a direct implementation of the fuel cell equations, above. The VHDL-AMS language is perfectly suited for this kind of modeling task, as the resulting model can so easily be used in broader circuit and system simulations, directly on the explore.partquest.com website.
- 275 views